Tom McDonnell
Introduction
We do not know the distribution of household wealth in Ireland. The reason is straightforward. We do not yet have sufficiently high-quality data usable for distributional analysis – the type of analysis that would allow us to know what groups within society own what share of wealth. We cannot even be certain about aggregate net wealth in Ireland or of the composition of wealth by asset type.
Household balance sheet data, such as quarterly accounts data, is of minimal use for distributional analysis as it provides only aggregate data and excludes certain types of asset. On the other hand, survey data contain systemic biases due to the undervaluation and/or omission of certain asset types – for example, financial and personal assets.
Voluntary surveys achieve a poor response rate. The very wealthy are likely to be under-represented due to non-response, while those who do respond are likely to undervalue their wealth. Household surveys are therefore unlikely to be representative of the circumstances of the very wealthy.1 In practice, this means surveys such as the European Central Bank’s Eurosystem Household Finance and Consumption Survey (HFCS) will tend to underestimate the relative wealth of the very wealthy and to overestimate the share of gross assets represented by ‘real assets’. (The term ‘real assets’ refers to physical assets, such as agricultural land, residential housing and commercial real estate.) Even so, the news that the Central Statistics Office (CSO) is currently conducting such a survey in Ireland is welcome and long overdue.
Studies on Wealth in Ireland
1971 Data
Data from inheritance tax and estate duty have sometimes been used as a source of information, albeit limited, on wealth holdings and wealth distribution. Patrick Lyons, using estate duty data in 1971, found that per capita wealth in Ireland in 1966 was £676 (or £1,130 per adult) and that total wealth was £1.948 billion.2 He also estimated that the top 5 per cent of the adult population held 72 per cent of household wealth.
However, the estate duty method is likely to underestimate wealth and the estimates by Lyons were criticised on a number of grounds. There may have been a systemic underestimation of agricultural assets, making the overall estimate for wealth too low. The estate duty approach is also problematic because it excludes large numbers of people who die leaving small estates which do not come to the attention of the tax authorities. Certain types of property may also be excluded from estate duty, while other types of property may be over-valued or under-valued. Subsequent research reduced the estimated share of the top 5 per cent of wealth holders to 70 per cent or even 57 per cent of total wealth, but obviously these revised estimates would still represent a high degree of wealth inequality.
1987 Data
Brian Nolan used 1987 data from the ‘Survey of Income Distribution, Poverty and Usage of State Services’, which was carried out by the Economic and Social Research Institute (ESRI), to estimate the wealth of Irish households.3 Nolan estimated that the top 10 per cent of households held 42.3 per cent of household wealth; the top 5 per cent held 28.7 per cent; and the top 1 per cent held 10.4 per cent. The bottom 50 per cent of households held just 12.2 per cent of net household wealth. Strikingly, the top 2 per cent of households held more wealth in total than the entire bottom 50 per cent. In looking at these figures, it must be borne in mind that, as already noted, survey data such as this will actually underestimate the wealth of the very wealthy as non-disclosure is likely to be much more pervasive for wealthier households. One reason is that financial assets are far more susceptible to non-disclosure than real assets and financial assets make up a higher proportion of the net wealth of wealthier households.
Nolan found that the principal residence was by far the most important component of reported wealth. The principal residence made up 55 per cent of the total even after subtracting for mortgages outstanding. Farm land was next at 26.5 per cent after subtracting for farm loans outstanding. This was followed by unincorporated businesses at 7 per cent. Ownership of financial assets and unincorporated businesses was particularly concentrated in wealthier households. On the other hand, ownership of the principal residence was much more evenly distributed over the entire population.
Bank of Ireland and Credit Suisse Reports
Bank of Ireland (BOI) and Credit Suisse have published more recent estimates of wealth and wealth distribution in Ireland.
According to a BOI report published in 2007, net household wealth in 2006 was €804 billion (€196,000 per capita), and the gross assets of Irish households were worth €965 billion.4 Of this total, €671 billion was in the form of residential property and €24 billion was commercial property. Deposits were valued at €92 billion, pension funds at €71 billion, and business equity at €50 billion.
The report also estimated that the composition of assets was as follows: 72 per cent property; 15 per cent equities; 3 per cent bonds, and 10 per cent cash. The BOI report does not appear to include the value of land, vehicles, personal property, and certain financial assets such as, for example, life assurance policies. According to the report, the top 1 per cent of the population held 20 per cent of household net wealth in 2006, while the top 5 per cent of the population held 40 per cent of household wealth. It is not entirely clear how these estimates were derived, although the report does state that a wealth concentration similar to that of the UK and other Anglo-Saxon economies was assumed.
The Credit Suisse report brings us into the post financial crash environment.5 It estimates that in 2011 the average net wealth per adult in Ireland was $181,000 (€126,000) and that the median wealth was $100,000 (€69,000). The value of real assets was estimated at €336 billion, financial assets at €302 billion, and liabilities/debt at €210 billion. The Credit Suisse report therefore places net household wealth in 2011 at approximately €428 billion. The report does not decompose either real assets or financial assets by type.
Regarding the distribution of wealth, the Credit Suisse report estimates that the top 1 per cent of the population held 28.1 per cent of household wealth in 2011, and that the top 5 per cent held 46.8 per cent of household net wealth. The estimated wealth distributions for both the Bank of Ireland report and the Credit Suisse report should be treated with a degree of caution as there are issues regarding data sources and the lack of inclusion of certain asset types. Even so, the results suggest a highly unequal distribution of wealth.
2014 Central Bank Accounts
The Central Bank of Ireland’s Quarterly Financial Accounts6 includes data on household net worth.7 Household net worth in the first quarter of 2014 was estimated at €508.5 billion or €110,312 per capita.
The Quarterly Financial Accounts also show that household debt in the first quarter of 2014 stood at €164.3 billion or €35,694 per capita. Census 2011 reports an average household size of 2.73. This suggests that in Ireland there is a mean net worth per household of approximately €301,152. Unfortunately, this data cannot provide a picture of the actual distribution of wealth as it only looks at household wealth in aggregate. It does, however, illustrate that Ireland remains a wealthy country even after the ending of the Celtic Tiger era.
CSO Data
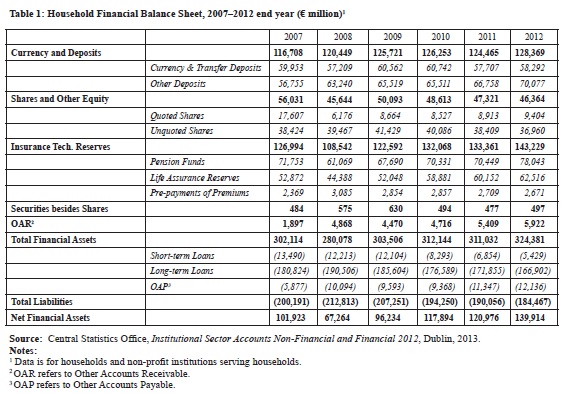
The Central Statistics Office (CSO) began publishing Institutional Sector Accounts in October 2011.8 These include data relevant to looking at one aspect of wealth-holding in Ireland, namely financial wealth, but do not cover ‘real assets’. The CSO Accounts provide information from 2002 onwards for the financial assets and liabilities of the household sector (see Table 1, p.10). The household sector was a net borrower up to the end of 2008, by which time borrowing had peaked at €212.8 billion. Irish households became net lenders from 2009 onwards.
Net financial wealth in 2011 was reported as €120.9 billion and increased to €139.9 billion in 2012. Gross financial assets were €324.3 billion in 2012, while liabilities were €184.4 billion. Insurance Technical Reserves at €143.2 billion (44.2 per cent) made up the largest component of financial assets in 2012.9 This was followed by currency and deposits at €128.4 billion (39.6 per cent), and shares and other equity at €46.4 billion (14.3 per cent).
Dynamics of Wealth
Much of the dynamics of net wealth is driven by capital gains and losses on real and financial assets rather than by the active accumulation of savings by households. Irish households have suffered large declines in net wealth since 2006, reflecting the dramatic deterioration in the value of housing assets and the exposure of Irish households to the housing market. By the fourth quarter of 2010, household net wealth had fallen close to its level in the third quarter of 2003. The general decline in the value of real and financial assets explains almost all of the fall in net wealth during this period. This fall was nearly identical to the fall in the value of the housing stock.
However, a 2012 study of the impact of the financial crisis found that, despite their collapse in value, housing assets still represented just over three-quarters of household net worth in Ireland in 2010.10 The study also showed the net worth of Irish households as a percentage of disposable income fell by a massive 164 percentage points between 2007 and 2010 – from 723 per cent to 559 per cent. This was the largest decline in net worth of fourteen countries studied.11Ireland also had the second largest percentage decrease in net financial wealth over the period 2007 to 2010.
Cross Country Trends
While the holding of assets by households varies considerably from country to country, there are some general trends. A large proportion of household wealth in all countries is concentrated in housing assets. The proportion of households in Ireland that were owner occupied in 2011 was 69.7 per cent, according to the April 2011 Census. This proportion is relatively high compared to most other euro area countries and suggests that housing assets as a proportion of total assets may also be comparatively high in Ireland.
Household Finance and Consumption Survey
The euro system Household Finance and Consumption Survey (HFCS)12 is the most comprehensive dataset available for household level net wealth,13 wealth composition, and wealth distribution in the euro area. Ireland and Estonia were not included in the ‘first wave’ of this survey which assembled data from every other euro area Member State for the year 2010. The results of this first wave of the survey were published in 2013.
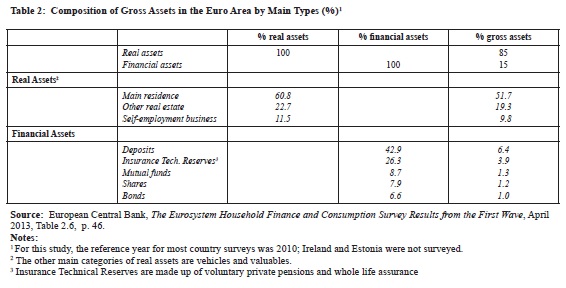
Components of wealth: Data from the HFCS suggests real assets make up almost 85 per cent of the value of assets in the euro area (see Table 2, p. 11).14 For homeowners, the dominant components of net wealth appear to be housing assets and associated debts such as mortgages, whereas financial assets and liabilities (excluding mortgages) have only limited impact on net wealth. However, this 85 per cent figure is probably a gross overestimation of the relative weight of real assets in total assets because financial assets are much less likely to be disclosed by survey respondents. For instance, and in contrast to the data from the HFCS, a cross country analysis of data on wealth-holding in the year 2000 found that for most countries non-financial assets accounted for between 40 per cent and 60 per cent of total assets.15 This may suggest the HFCS suffers from significant biases related to the under-valuation and/or non-disclosure of financial assets. The HFCS also fails to cover public and occupational pensions which in some countries may be quite substantial as a proportion of gross assets.
Composition of real assets: The HFCS shows that the composition of real assets is unevenly spread across wealth and income groups (see Table 3 below). It reveals that self-employment business wealth makes up a much larger component of real assets for the top 20 per cent of wealth holders than it does for less wealthy groups: for this top group, it represents 16.8 per cent of real assets. Non main residence real estate property is also a much more important component of real assets for the wealthiest group than it is for less wealthy households. Self-employment business wealth and ownership of commercial real estate properties are also both highly concentrated in the wealthiest group. The relative importance of these assets is likely to be even more exaggerated for the top 5 per cent of households and especially for the top 1 per cent of households.
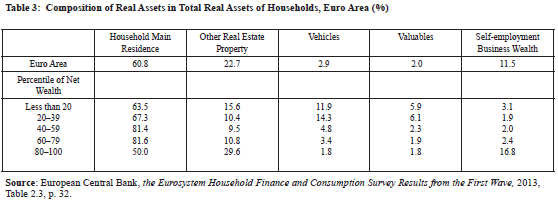
The household main residence makes up a much smaller component of real assets for the wealthiest 20 per cent than it does for the other groups. Even so, the household main residence is still by far the most important component of real assets for the wealthiest 20 per cent. The small share of valuables in total real assets may reflect systemic under-valuation but may also suggest that the problem of under-valuation of valuables is not that important in the wider context of estimating net household wealth.
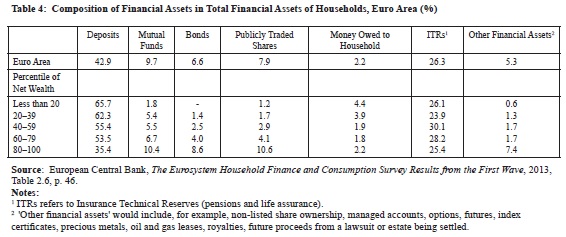
Composition of financial assets: The HFCS also gives us data for financial assets. The composition of financial assets in the euro area is shown in Table 4 above. Deposits are the most important financial asset both overall and for each individual group. Indeed, deposits represent over half of all financial assets for all bar the wealthiest group (35.4 per cent). Deposits and Insurance Technical Reserves combined make up over 60 per cent of total financial assets for each group and over 80 per cent of total financial assets for all but the wealthiest group (60.8 per cent).
Mutual funds, bonds and publicly traded shares combined make up almost one-third (29.6 per cent) of the financial portfolio of the wealthiest group. This is significantly higher than the figure for any other group: it is, for example, twice the figure for the second wealthiest group, for whom mutual funds, bonds and shares represent just 14.8 of financial assets. The relative importance of such assets is likely to be even more pronounced for the wealthiest 1 per cent of households.
Wealth distribution: The distribution of wealth within a country is shaped by a range of institutional factors including the country’s economic history; its present economic structure; its sectoral composition of home ownership; its tax policy; its pension policy, and its demographics.
The HFCS data reveal a picture of an extremely unequal distribution of wealth in the Member States of the euro area: the wealthiest 10 per cent of households in the euro area held over half of all household wealth (50.4 per cent) and the wealthiest 5 per cent held more than a third (37.2 per cent) of household wealth.16
The large difference between median net wealth (€109,200) and mean net wealth (€230,800) is evidence of the extreme unevenness in the distribution of net wealth (see Table 5). Households in the 10th percentile have just €1,200 in net wealth on average, whereas households in the 90th percentile have €506,200 in net wealth on average – in other words, the 90th percentile controls 422 times the net wealth of the 10th percentile. The bottom 20 per cent of households have negative mean net wealth. The top 50 per cent of households own 94 per cent of total net household wealth, while the top 20 per cent own 67.6 per cent of net wealth.
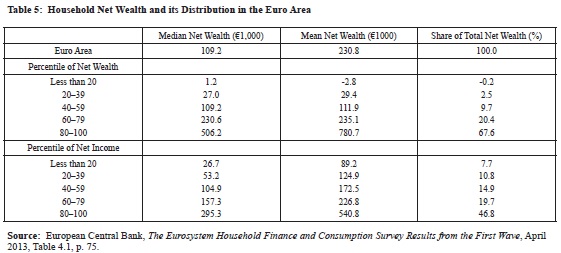
Within the euro area, then, it is clear that wealth-holding is highly concentrated. Moreover, as Table 5 also shows, the distribution of wealth is even more unequal than is the distribution of income (though this too is very uneven).
Applying the HFCS Findings to Ireland
What might be the outcome if the findings on the distribution of wealth from the first wave of the HFCS were to be applied to Ireland – which was not, of course, one of the countries included in the survey?
As already noted, the Central Bank’s Financial Accounts give, as an estimate, a figure of €508.5 billion for the ‘net household worth’ in Ireland in the first quarter of 2014. In this estimate, household net worth is calculated as the sum of the household sector’s housing and financial assets minus its liabilities.
If the distribution of wealth in Ireland were assumed to mirror the distribution in the euro area as shown by the HFCS, with the top 5 per cent of households owning 37.2 per cent of net wealth, then the top 5 per cent of households in Ireland would hold €189.2 billion in net assets. Census 2011 data indicates there are 1,680,678 households in Ireland and so the top 5 per cent represents 84,034 households. A total household net wealth of €189.2 billion divided by 84,034 households is equivalent to a mean household net wealth for the top 5 per cent of €2.25 million.
However, it is unclear to what extent the distribution of net wealth in Ireland actually does mirror that of the euro area. We do not have the data. The true distribution may well be substantially different and therefore any estimate of the wealth held by particular groups should be treated with extreme caution. Ireland’s inclusion in future euro system surveys will provide more reliable estimates of the distribution of net wealth in Ireland.17 Brian Nolan’s study, using data from the last survey of household wealth in Ireland (i.e., 1987), estimated that the top 5 per cent of households held a somewhat smaller proportion of net household wealth (28.7 per cent). If this proportion were to be assumed as accurately reflecting wealth distribution in Ireland in 2014 then the net household wealth of the top 5 per cent would be valued at €145.9 billion, which amounts to €1.74 million per household.
Conclusion
In Ireland, efforts to assess the distribution of wealth or even to establish the aggregate wealth of the country have been sporadic and limited. However, the studies that have been undertaken over the past forty years point in every instance to a distribution of wealth that is highly skewed in favour of a small minority of the population.
Estimates of the percentage of wealth held by the top 5 per cent have varied considerably between studies (from, for example, 28 per cent to over 40 per cent) – as have estimates of the share held by the top 1 per cent (from 10 per cent to over 28 per cent). Such variations reflect differences and limitations in the methodologies employed. But the overall message is clear: wealth-holding is highly concentrated in Ireland, as it is in other countries of the euro area. The obverse of the concentration of wealth among a minority is that a significant part of the population has little or no wealth.
In addition, studies on wealth indicate that the composition of the assets held by the top 10 per cent is likely to be quite different from that of the population overall, while the asset mix of the top 1 per cent will be different again. For wealthier cohorts, financial assets tend to represent a larger component of their overall assets. This is significant not only in terms of the actual distribution of wealth but in so far as it has a bearing on the extent to which the distribution of wealth can be fully and accurately assessed since financial assets are much more susceptible to non-disclosure than real assets.
Notes
1. Robin Boadway, Emma Chamberlain and Carl Emmerson, ‘Taxation of Wealth and Wealth Transfers’, in Stuart Adams et al (eds.), Dimensions of Tax Design: The Mirrlees Review (Chair: Sir James Mirrlees), Oxford: Oxford University Press for the Institute for Fiscal Studies, 2010, pp 737–836.
2. Patrick M. Lyons, ‘The Distribution of Personal Wealth by County in Ireland, 1966’, Journal of the Statistical and Social Inquiry Society of Ireland, 22(5), 1972.
3. Brian Nolan, The Wealth of Irish Households: What Can we Learn from Survey Data?, Dublin: Combat Poverty Agency, 1991.
4.Bank of Ireland, The Wealth of the Nation: Update for 2007, Dublin: Bank of Ireland, 2007.
5. Credit Suisse Research Institute, Global Wealth Databook 2011, Zurich, October 2011.
6. Central Bank of Ireland, Quarterly Financial Accounts for Ireland: Q1 2014, Dublin, September 2014. (http://www.centralbank.ie/polstats/stats/qfaccounts/Documents/2014q1_ie_qfaccounts.pdf)
7. The Central Bank calculates household net worth as the sum of the household sector’s housing and financial assets minus their liabilities.
8. Central Statistics Office, Institutional Sector Accounts Non-Financial and Financial 2012, Dublin: Stationery Office, 2013.
9. Insurance Technical Reserves are made up of net equity in pension funds and life assurance reserves.
10. Mary Cussen, Brídín O’Leary and Donal Smith,‘The Impact of the Financial Turmoil on Households: A Cross Country Comparison’, Central Bank Quarterly Bulletin, 02, April 2012, pp 78–98. (http://www.centralbank.ie/publications/documents/Quarterly%20Bulletin%20Q2%202012.pdf)
11. Ibid.
12. European Central Bank, The Eurosystem Household Finance and Consumption Survey Results from the First Wave, Statistics Paper Series 2, Frankfurt: ECB, April 2013.
13. Care is required when interpreting cross country comparisons of net household wealth. One reason is the cross country variation in household characteristics. For example, a higher rate of home ownership will be associated with higher levels of net household wealth but with lower levels of net wealth in the government and/or corporate sector.
14. The HFCS classifies self-employment businesses, where at least one member of a household works as self-employed or has an active role in running the business, as real assets.
15. James B. Davies, Susanna Sandström, Anthony B. Shorrocks and Edward N. Wolff, The Level and Distribution of Global Household Wealth, Cambridge MA: National Bureau of Economic Research, 2009, NBER Working Paper No. 15508, p. 4. (http://www.nber.org/papers/w15508.pdf)
16. The top 10 per cent of income earners earned 31 per cent of total income, while the top 5 per cent earned 20.2 per cent of total income.
17. The first results for Ireland are expected to be published in late 2014.
Tom McDonnell Ph.D. is an economist working at the Nevin Economic Research Institute (NERI).
